In this article we will be building a very simple monitor that allows to observe some OS parameters, such as free memory available. In this article we will be using the NodeJS, Angular 4 and Chart.js, so ensure you have node and Angular studio IDE installed. To create our development server we will be using vagrant, so check here for instructions to install vagrant on your operating system.
We will be creating two code repos, the first is a node application that will monitor the OS parameters and sends it via websocket to the second app which is an Angular 4 application, the Angular app will utilize Chart.js to represent the server status graphically.
Server App
Let’s create our server app, by running the following commands in our terminal
We want our server to run Ubuntu 16.04, have a static IP address 192.168.50.4 and have NodeJS installed, so replace the content of Vagrantfile with
and create a provisioning script named bootstrap.sh with the content
In the script above, we first update the apt repository and then we install NodeJS from a private PPA, install build-essential which is required by some NodeJS modules and install forever which helps us keep a node script running forever. No we start the vagrant server with th command:
Lets create a package.json file with the content below in our duneserver directory
Our package.json contains 3 dependencies, os-monitor–a very simple monitor for the built-in os module in Node.js, nodemon–monitor for any changes in your node.js application and automatically restart the server – perfect for development, and socket.io–enables real-time bidirectional event-based communication.
Let us create our index.js file with the content
In the code above we imported socket.io and created a server running on port 8000, next we imported os-monitor. The socket.io server will emit a connect event when a client app connects with it, so on connect we send the os type (osm.os.type) and number of cpus(osm.os.cpus()) to the client.
In the last two sections of the code above, we start monitoring the server using osm.start(), at an interval of 300ms. os-monitor emits a monitor event on each monitor cycle, so on monitor we use socket.io to send the monitorEvent to the client.
Let’s ssh into the vagrant server, install the node modules and start the web server
Angular App, Socket.io and Chart,js
Let’s get started by firing up our Angular IDE and create a new Angular project named DuneServerMonitor.
Create a new project
Once the project is created we can now add Socket.io and Chart.js to our project. Angular IDE has a terminal view from which we can execute commands, so from the menu select Window, then Show view then click Terminal +. In the opened terminal type the following commands to install Socket.io and Chart.js
Install dependencies from terminal
Monitoring the free memory
Let us include bootstrap css in our project, by adding the following lines to the head section of our src/index.html file.
Then we replace the content of src/app/app.component.html with
Replace the content of src/app/app.component.ts with
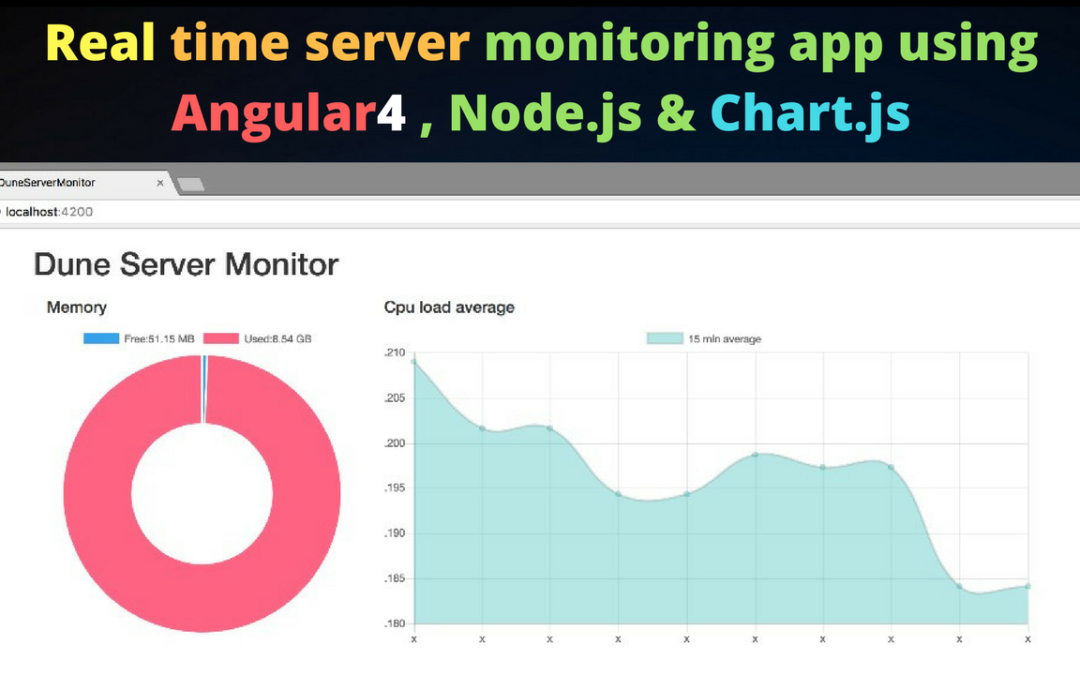
Our client app looks like the image below, we’ll now go on to discuss the sections of the code.
Section I
We used the Component decorator to mark our class as an Angular component and provide additional metadata that determines how the component should behave. The app component(app.component.ts) uses the content of app.component.html as it’s template and applies the style rules in app.component.css.
Our app class implements OnInit interface which we imported from ‘@angular/core’, so we can use the ngOnInit life cycle hook called by Angular to indicate that Angular is done creating the component. Finally, we created some class variables to be used in the succedding sections.
* socket which is an instance of the socket.io client
* memChart currently undefined, but will be assigned as an instance of Chart from Chart.js
* cpuChart currently undefined, but will be assigned as an instance of Chart from Chart.js
* cpuType and noOfCpu will be used to store the variables returned from the section of the server code highlighted below
Section II
Here we create an Doughnut chart to be used to display the free memory.
Here we create a line chart to be used to display the 15 minute cpu load average.
Section III
Here we are setting callbacks for the connected and os-update events emitted by our socket.io server.
* We set the connected method as the callback for the connected event
* We set the updateCharts method as the callback for the os-update
event
Section IV
Here we empty the the array that holds the labels for the free memory chart whose initial value is ['Free','Used'], then we push two new labels of the format Free:XXMB and Used:XXMB.
Here we empty the dataset for the doughnut chart and push new values, then we update the chart.
Finally let us run the Angular app, there is a server view in Angular IDE, in order to open it, select ‘Window’ then Show view then Servers, right click on DuneServerMonitor and click Start Server, Angular IDE serves the application on localhost port 4200 by default, so open up http://127.0.0.1:4200 in your browser to see the running app.
Start server
Our Final Real time server monitoring dashboard looks like this
This content was originally published here.


